Case 1. U-Plast website
Case 1. U-Plast website: part of the Visualiser ecosystem
The "Visualiser" project was conceived as an ecosystem combining several key components:
- Website - the public part of the project, product showcase and entry point for customers and dealers.
- Personal Cabinet / House Visualiser - a service for selecting and "fitting" facade materials on real objects.
- Analytics system for CRM - module for analysis of applications, traffic sources and customer behaviour.
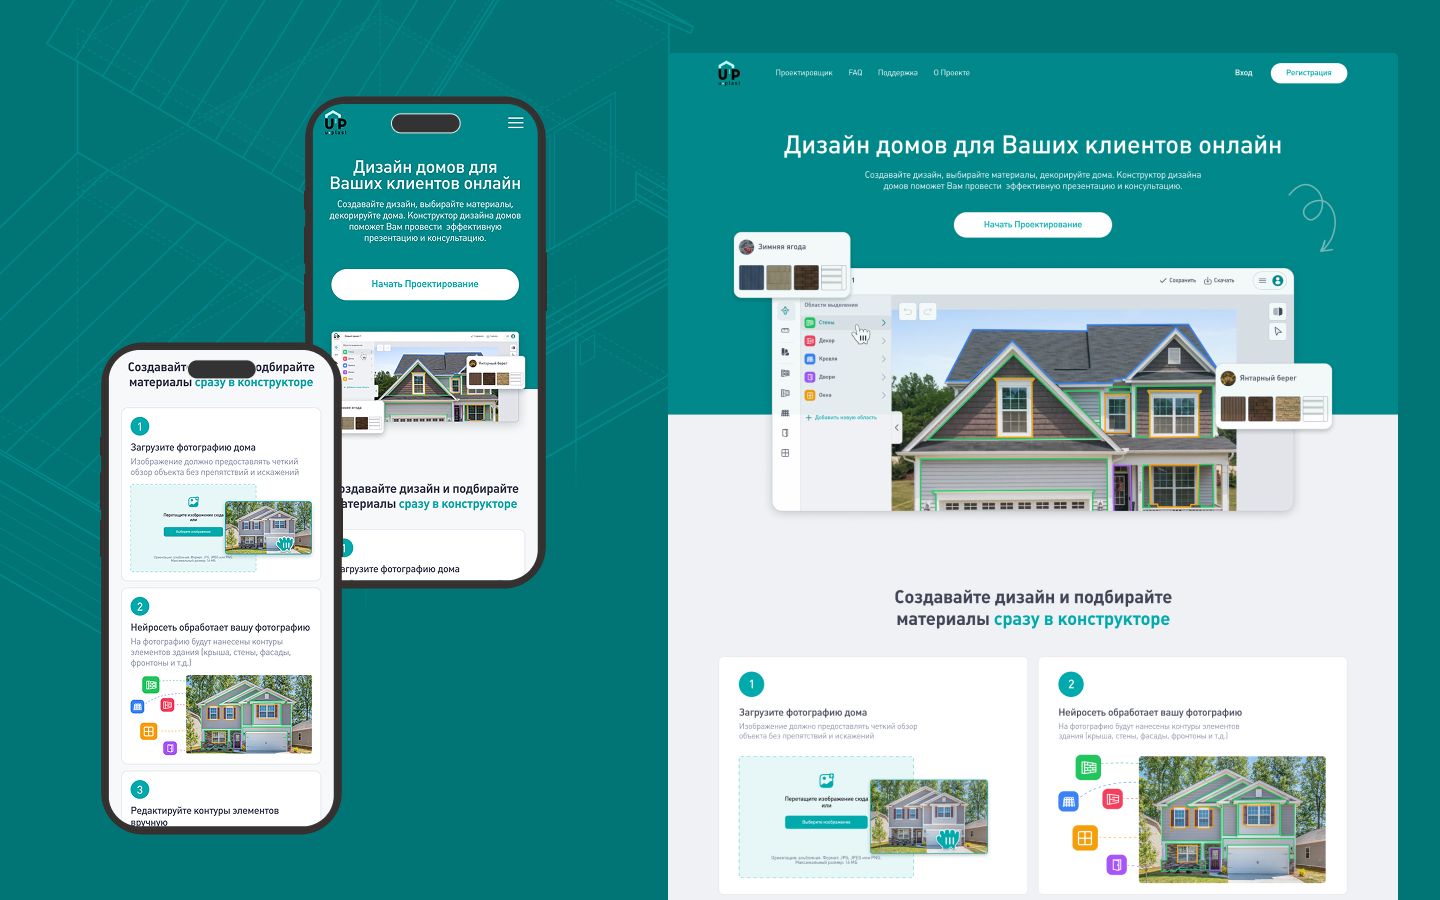
The Website in this ecosystem acts as the main communication platform: it presents the company, product catalogue, marketing materials and collects initial requests from customers. These requests and projects then flow into the visualiser and CRM for further processing.
The objectives of the website are.
- To present the company and its products in the CIS market and beyond.
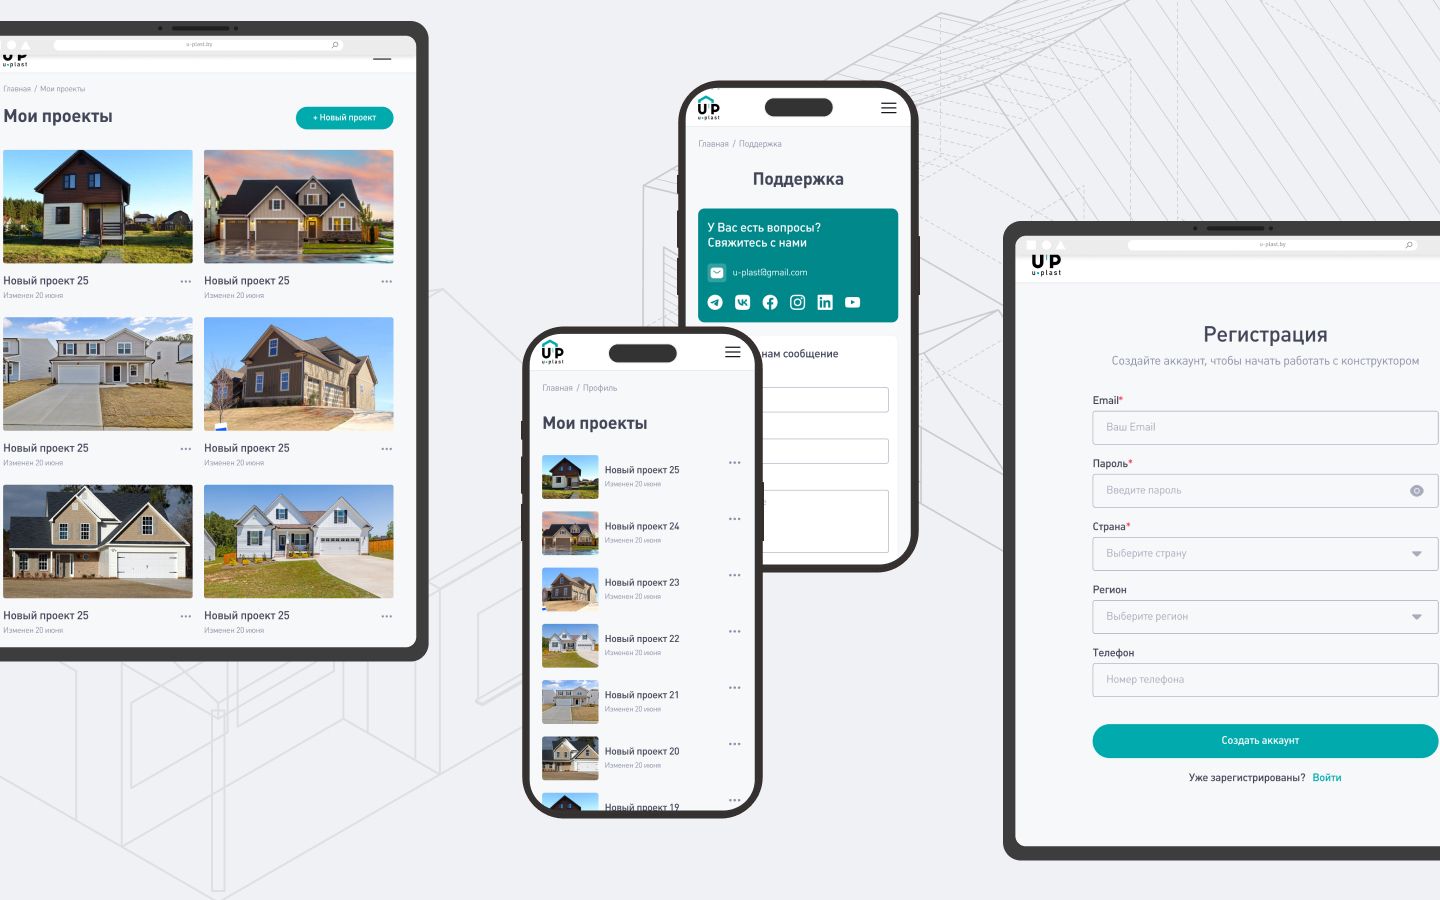
- To create a convenient user registration functionality.
- Integrate the website with SAP (project administration system) for centralised content management.
- Provide SEO-optimisation to enter new markets.
- Become an external entrance to the Visualiser ecosystem, from where the client can go to visualise or communicate with managers.
Basic functionality
Website
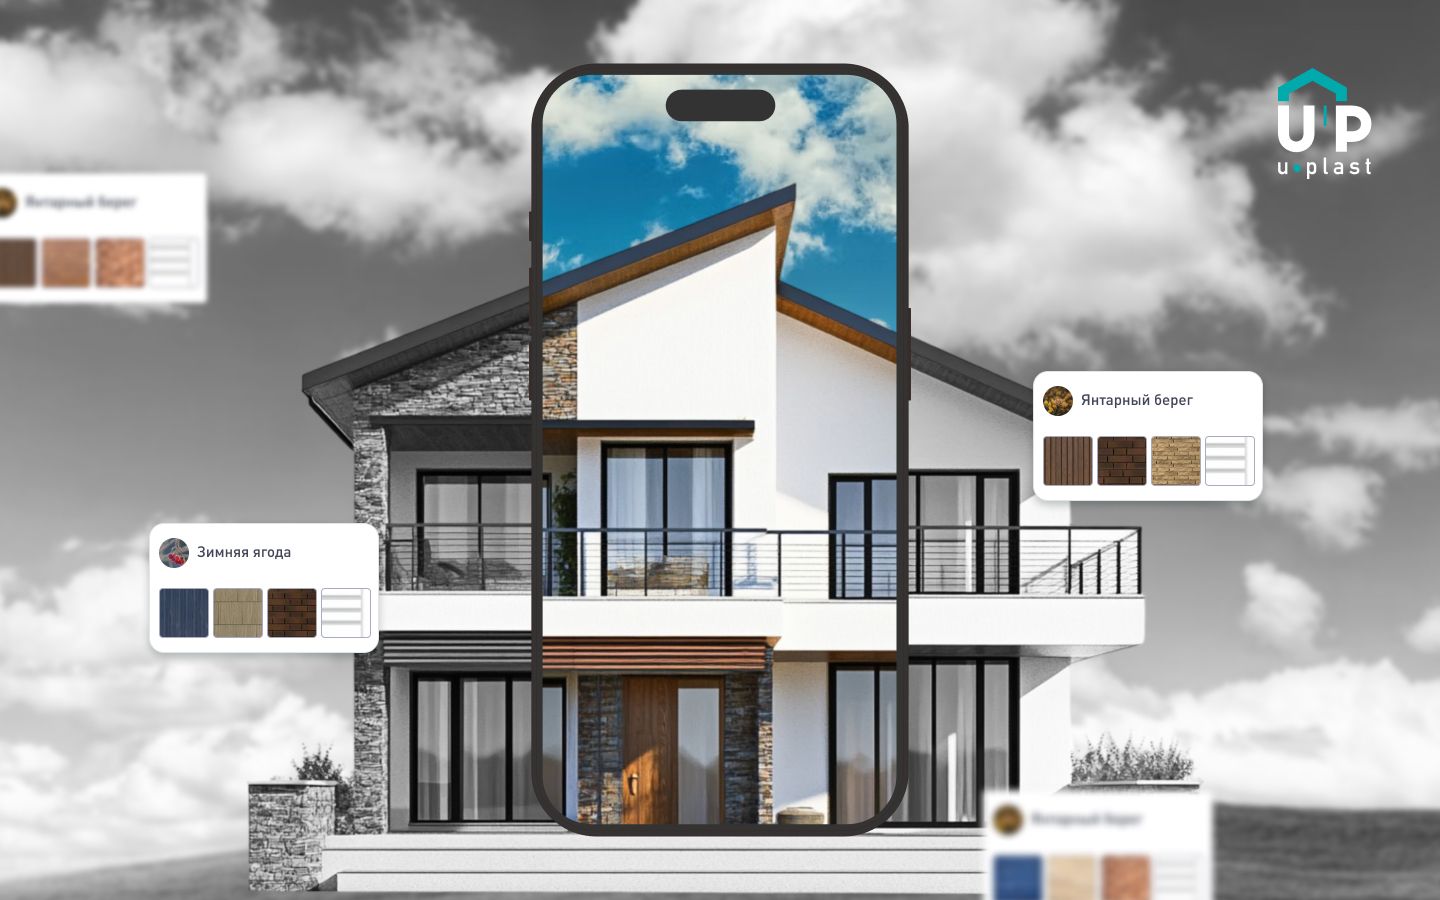
- Detailed description and technical specifications of Visualiser.
- Support section.
- FAQ with management via SAP.
- Moderation of Registered users.
SAP (project administration system)
- Management of created projects.
- Managing users and rights.
- Upload media files (images, PDF, XLS).
- Download XLS reports (by users, projects, files).
Stages of development
Analysis and planning (2 weeks):
- Agreeing the role of the site in the overall architecture of the Visualiser project.
- Preparing a site map and requirements for the SAP.
Design (2 weeks):
- Prototyping of pages.
- Designing the data architecture for the Projects.
Development (3 weeks):
- Frontend: React, adaptive layout.
- Backend: Symfony Framework.
- MySQL to store data about Projects, users and uploads.
- SAP implementation with differentiation of user rights.
Testing (2 weeks):
- Testing of all scripts.
- Testing of SAP, uploads, etc..
Launch and Support (2 weeks):
- Training of client's employees.
- Production launch and technical support. The whole process took three months.
Development Methodology
Kanban Methodology:
- Visualisation of tasks and progress on a Kanban board.
- Constant prioritisation by tasks depending on the overall logic of the Visualiser project.
- Minimise bottlenecks through task transparency.
Technology stack
- Frontend: React (JS, HTML5, CSS3).
- Backend: Symfony (PHP).
- Database: MySQL.
- Integrations: XLS-uploads, multi-language, social networks.
- SEO tools: meta-tag management and sitemap generation via SAP.
Why this particular stack is chosen:
React → provides a fast interface and high responsiveness. Symfony → suitable for complex business logic, easy to integrate with other project systems. MySQL → reliable storage for catalogue and user data.
Results
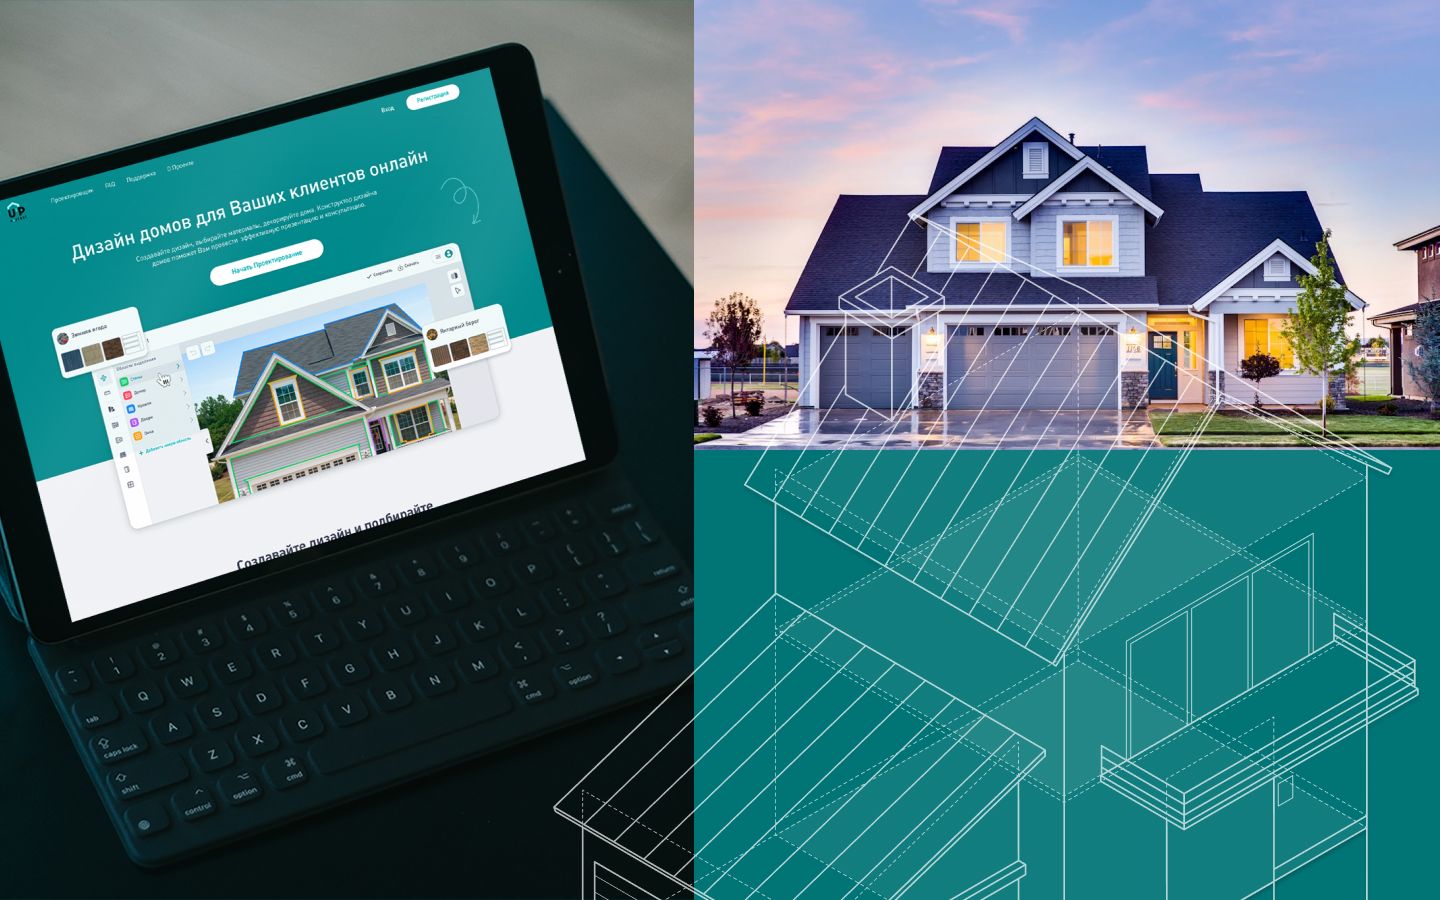
- A modern corporate website was created, which became the outer shell of the Visualiser ecosystem.
- Developed a flexible admin panel to manage the site.
- The site became an entry point for clients and dealers into the Visualiser ecosystem.
Team composition
- Project Manager: 1 person.
- Business analyst: 1 person.
- Backend-developers: 1 person.
- Frontend-developers: 1 person.
- Designer: 1 person.
- Testers: 1 person.