Radioplayer Analytics
Development of analytics in the personal cabinet for Radioplayer.by
The Radioplayer.by project is a modern online platform for radio stations, where users can listen to the air via web and mobile applications. At the stage of the project development we faced a task: to create a system of analytics in the personal cabinet, which would allow administrators and station owners to get detailed data about their audience.
We implemented an analytics module based on Yandex Metrics data, which is available in two scenarios: standard and advanced.
Development goals
- To provide radio station owners with a convenient tool for audience analysis.
- Provide transparency of data on web and mobile applications.
- Provide an opportunity to generate reports in different formats and periods.
- Increase the value of personal cabinet as a station management centre.
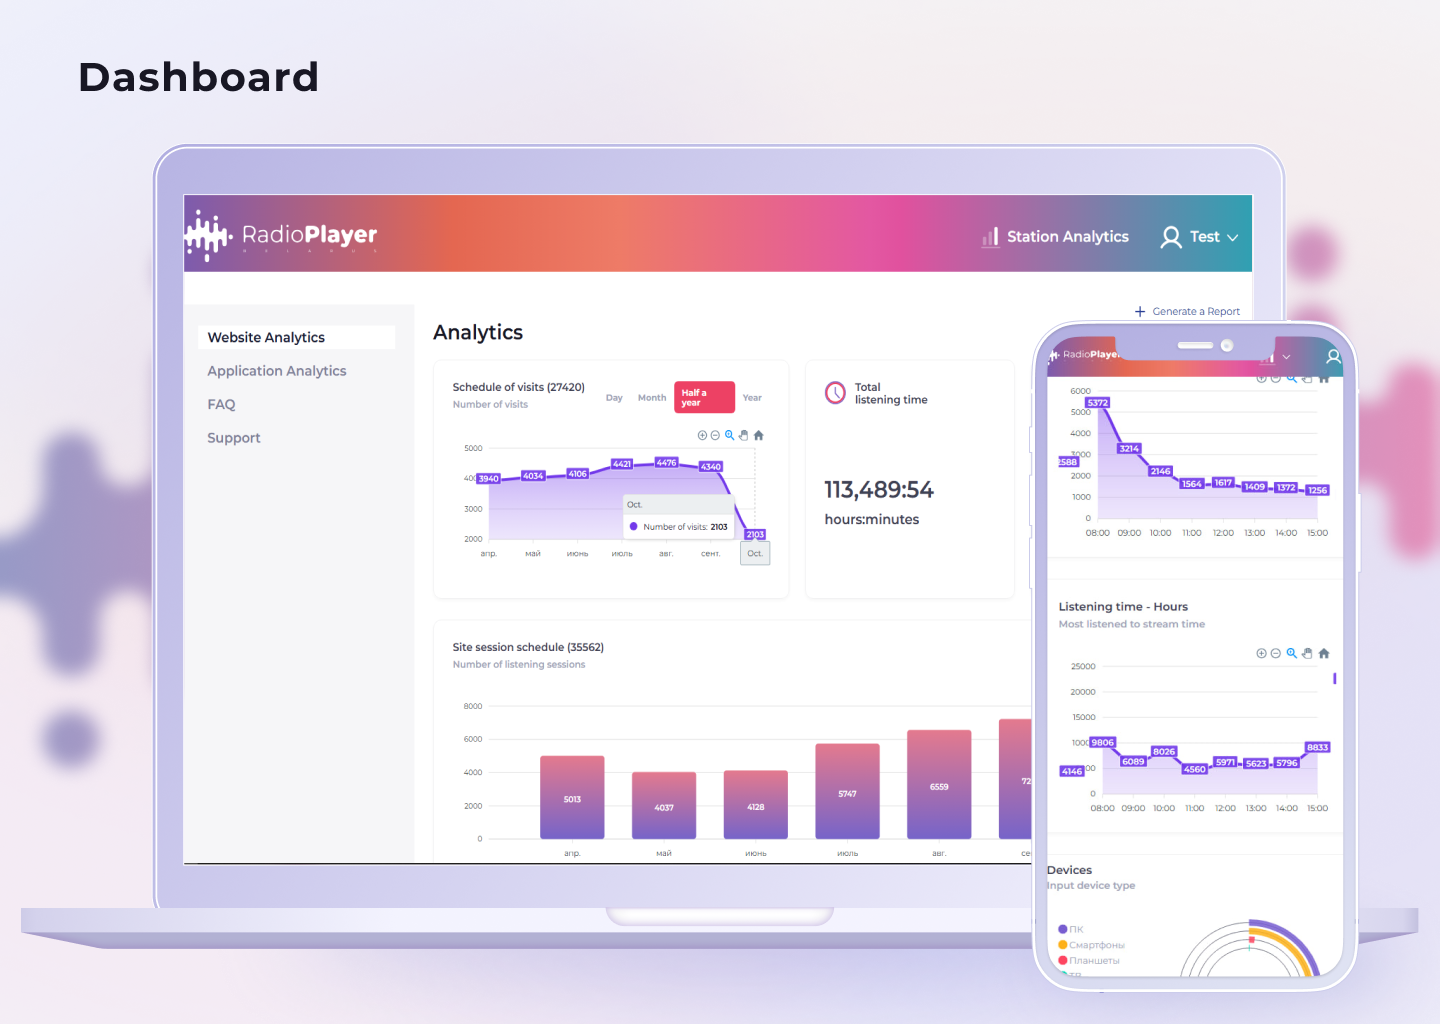
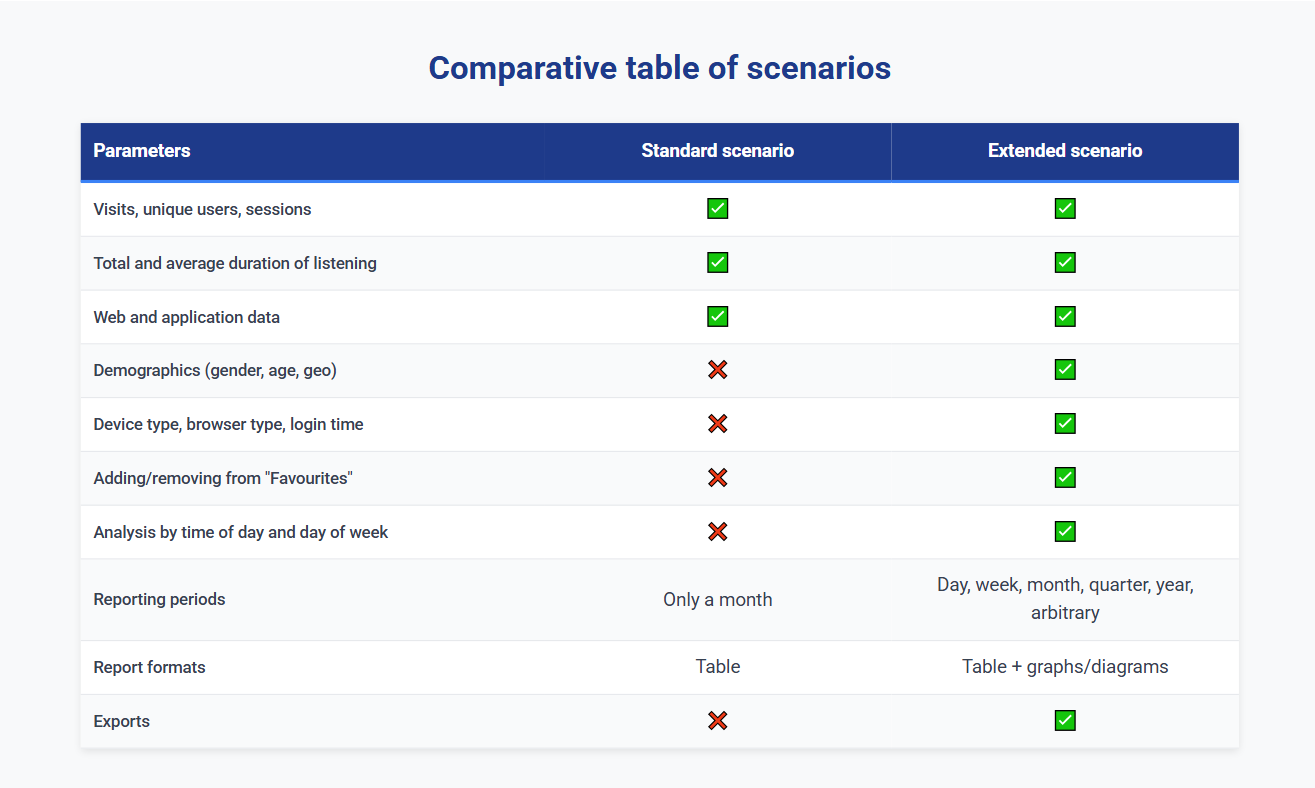
Standard analytics scenario
The basic scenario is available to all users of the personal cabinet by default.
Web (listening via website):
- number of visits;
- number of unique users;
- number of listening sessions;
- total duration of listening (hours:minutes);
- average listening time (hours:minutes).
Mobile app:
-
number of station clicks;
- number of unique users;
- number of listening sessions;
- total listening duration (hours:minutes);
- average listening duration (hours:minutes).
Features:
- report is only available for a full calendar month;
- data is available starting from January 2025;
- the current month is displayed only after its end;
- the report contains total figures without detailing by day.
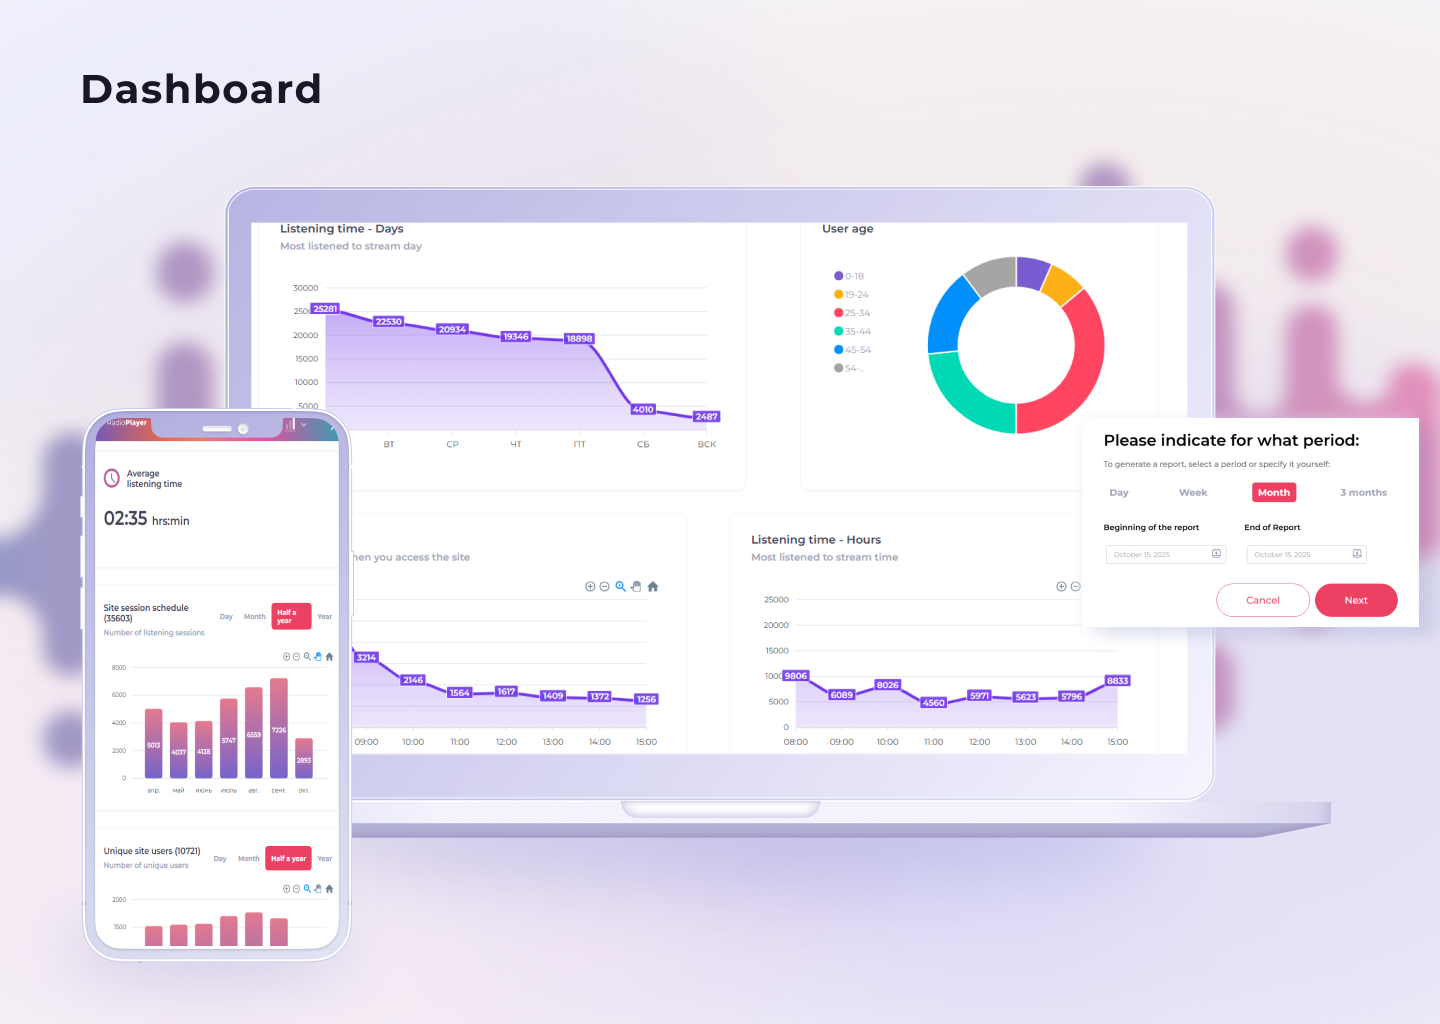
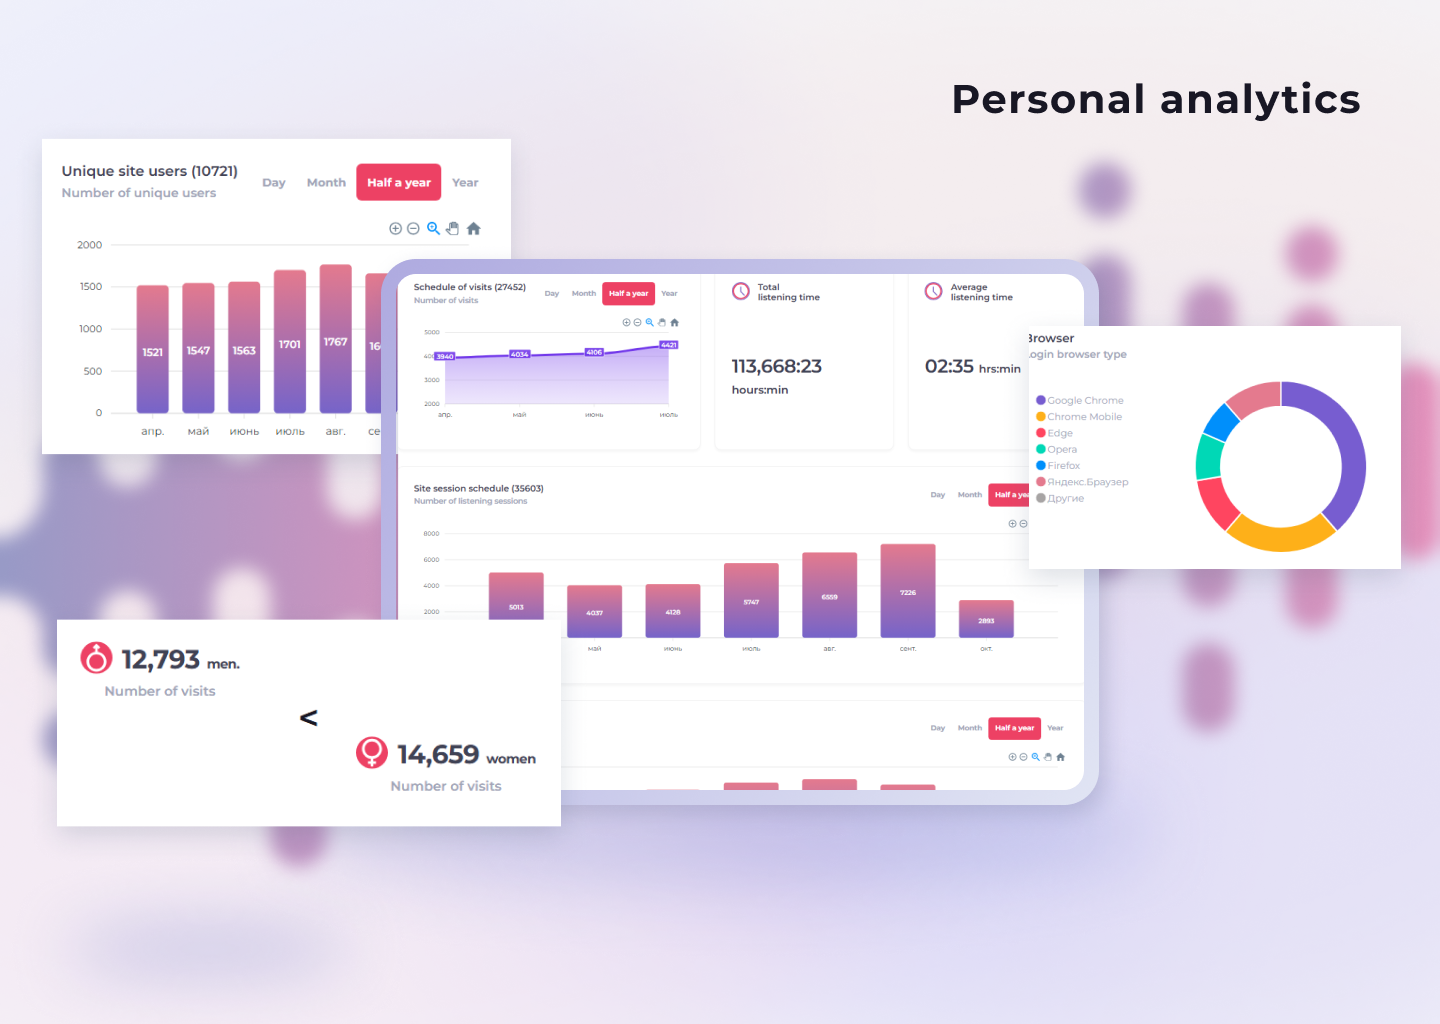
Advanced analytics scenario
The advanced scenario is assigned by the radio player administrator and includes all parameters of the basic scenario as well as additional data:
Demographics and technical parameters of users (if accessed in Metric):
-
gender, age, geolocation;
- device and browser type;
- time of day of login.
Station Interactions:
- Number of times a station has been added/removed to Favourites.
Analyse listening time:
-
distribution by time of day;
- distribution by day of the week.
Features:
- ability to generate reports for a day, week, month, quarter, year or arbitrary range;
- export of reports to a file;
- data presentation in tabular form and in the form of graphs/diagrams;
- detailing by hours, days, weeks or months.
Тtechnical realisation
Design:
- Designing interfaces in Figma.
- Special attention is paid to ease of navigation and data visualisation.
Frontend:
- Using JavaScript and HTML.
- ApexCharts library is used to create charts and graphs.
Backend:
- PHP (Symfony) development.
- Integration with Yandex Metrics API for data extraction.
- Flexible architecture for scaling and adding new metrics.
Features:
- High speed report loading.
- Ability to customise analytics parameters.
- Support for exporting data to file.
Results
- Station owners got a convenient tool for audience analysis.
- Administrators can flexibly manage access to advanced analytics.
- The system became a competitive advantage of Radioplayer.by, reinforcing the value of the personal account.
Conclusion
The development of analytics for Radioplayer.by was an important step in the development of the project. We created a tool that combines the simplicity of a basic scenario and the depth of advanced analyses. Thanks to this, radio station owners can make more informed decisions, and users get a service that evolves with their needs.