Case 2: House Visualiser for U-Plast
Project: Development of an online visualiser of facade materials as part of the "Visualiser" ecosystem for the manufacturer of siding and facade solutions U-Plast.
Visualiser's role in the project
Visualiser became the central tool of the ecosystem:
- The U-Plast website - the entry point and product catalogue.
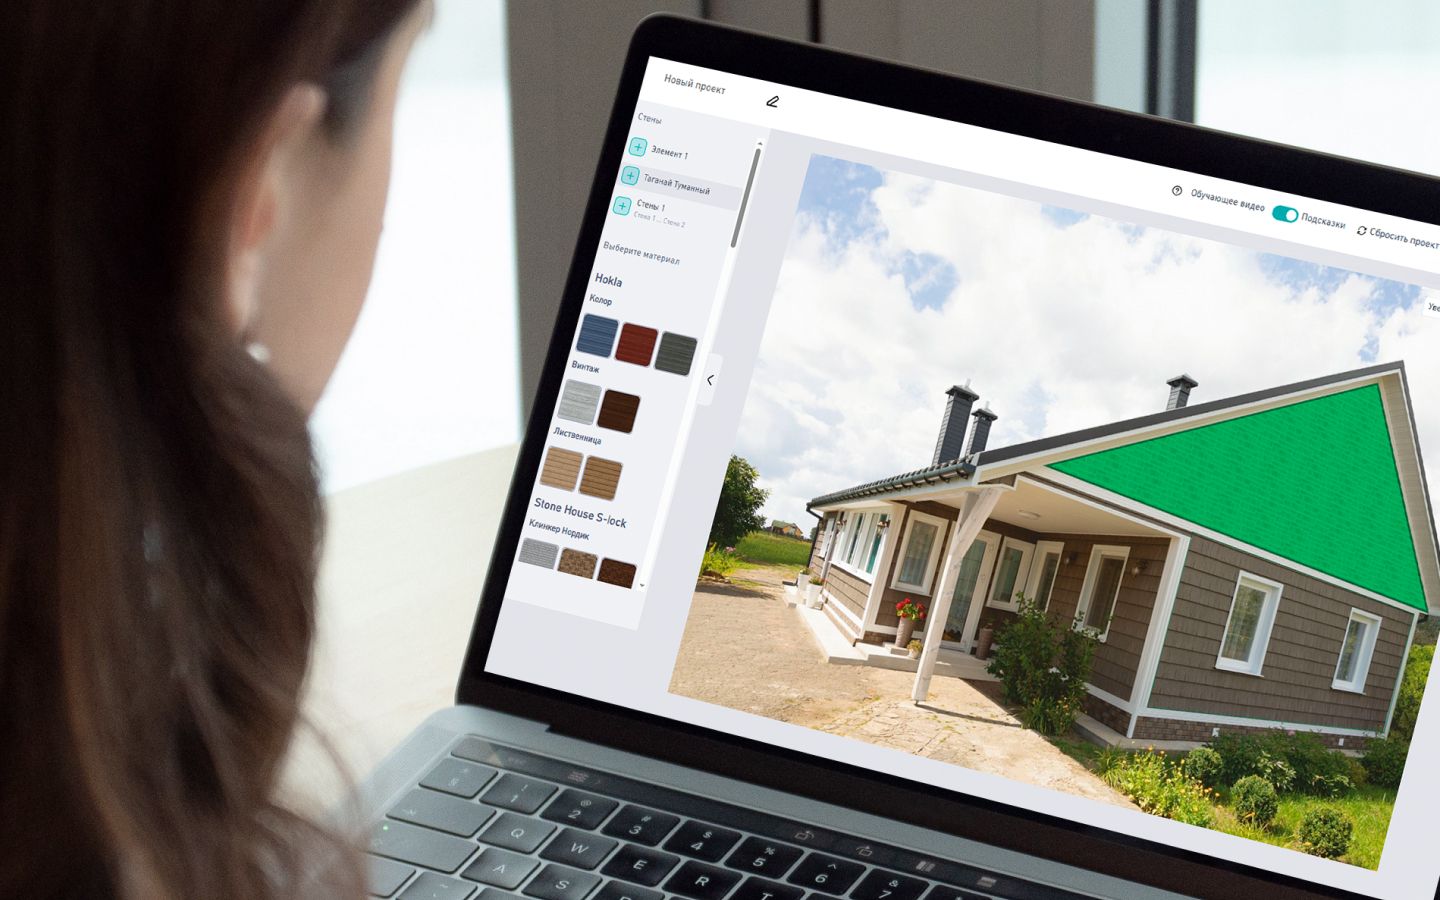
- Visualiser - an interactive tool for designing and "fitting" facade materials on clients' houses.
- CRM-analytics - collection of data on projects and user behaviour.
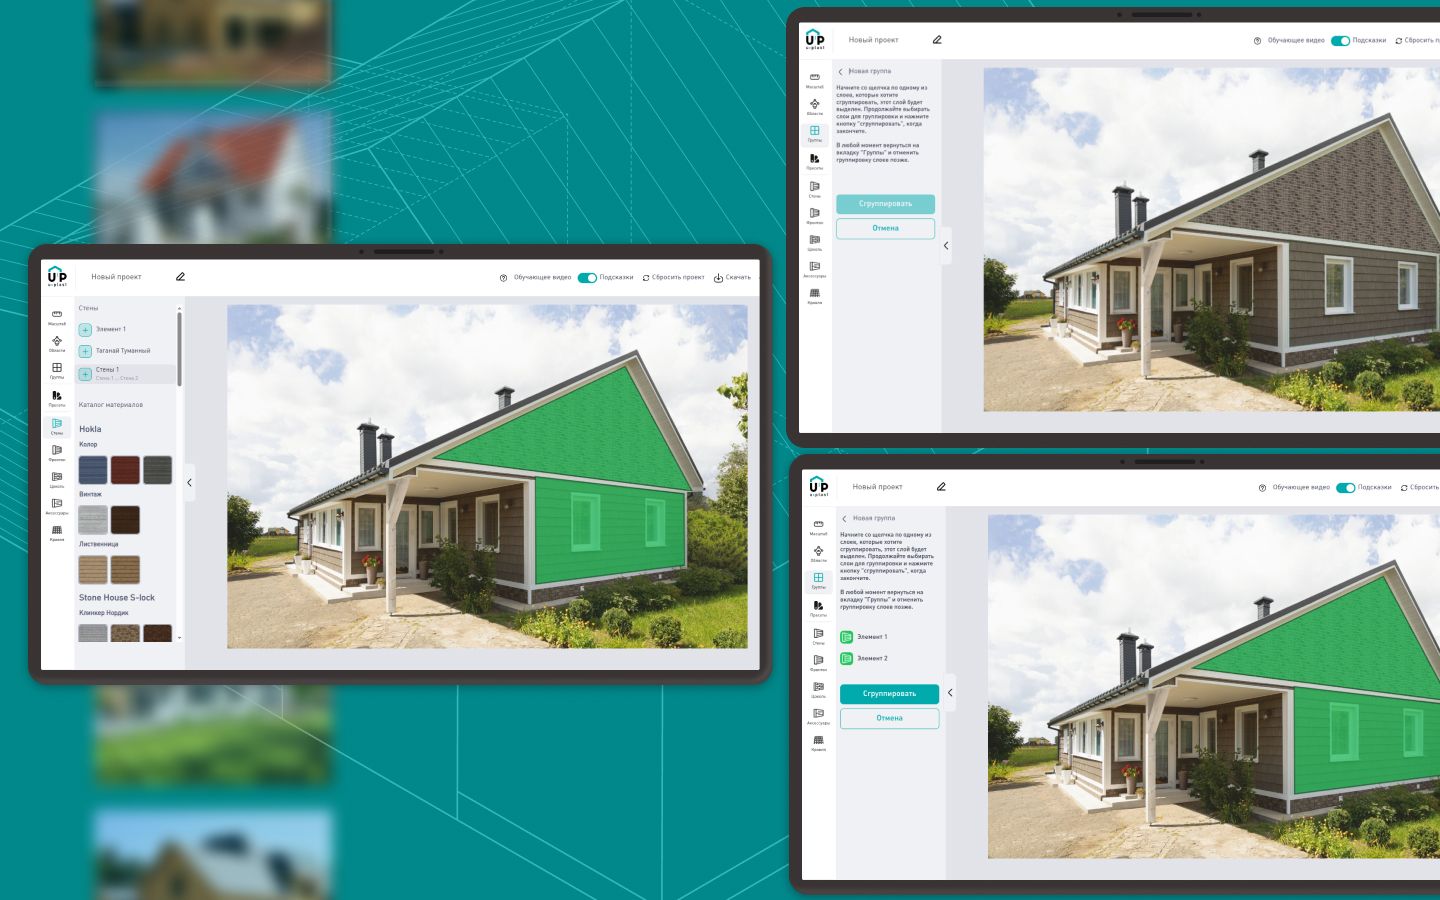
The main goal of the Visualiser is to allow users to "see the result before they buy", speeding up the selection process and increasing conversion into orders.

Basic functionality of Visualiser
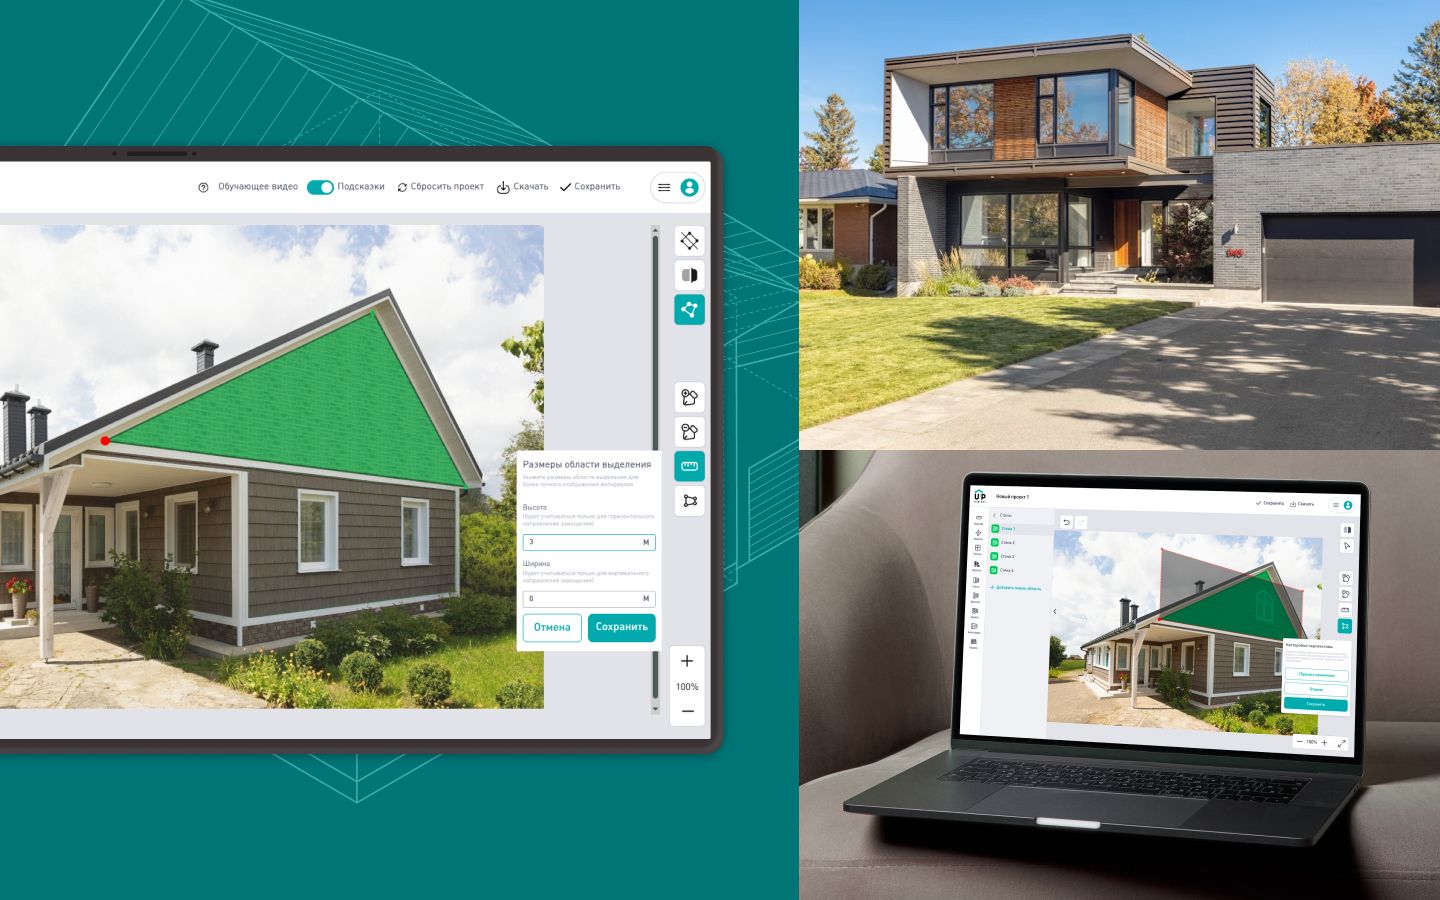
- Building scale editor for correct facade paving.
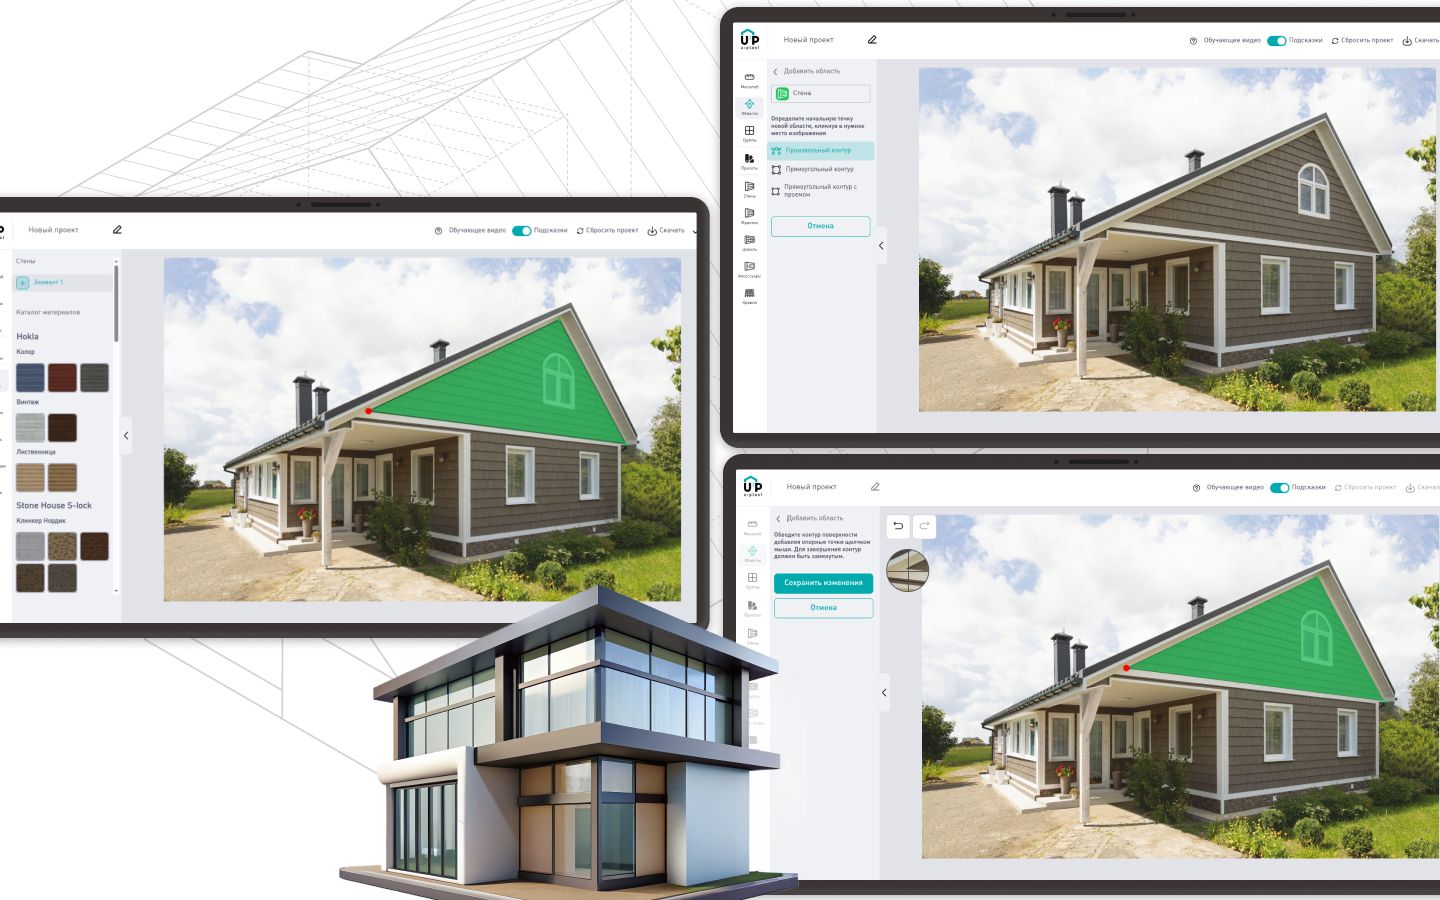
- Selection of areas (walls, windows, roof, doors, etc.).
- Deleting and merging areas for flexible work with objects.
- Before/after comparison to evaluate the result.
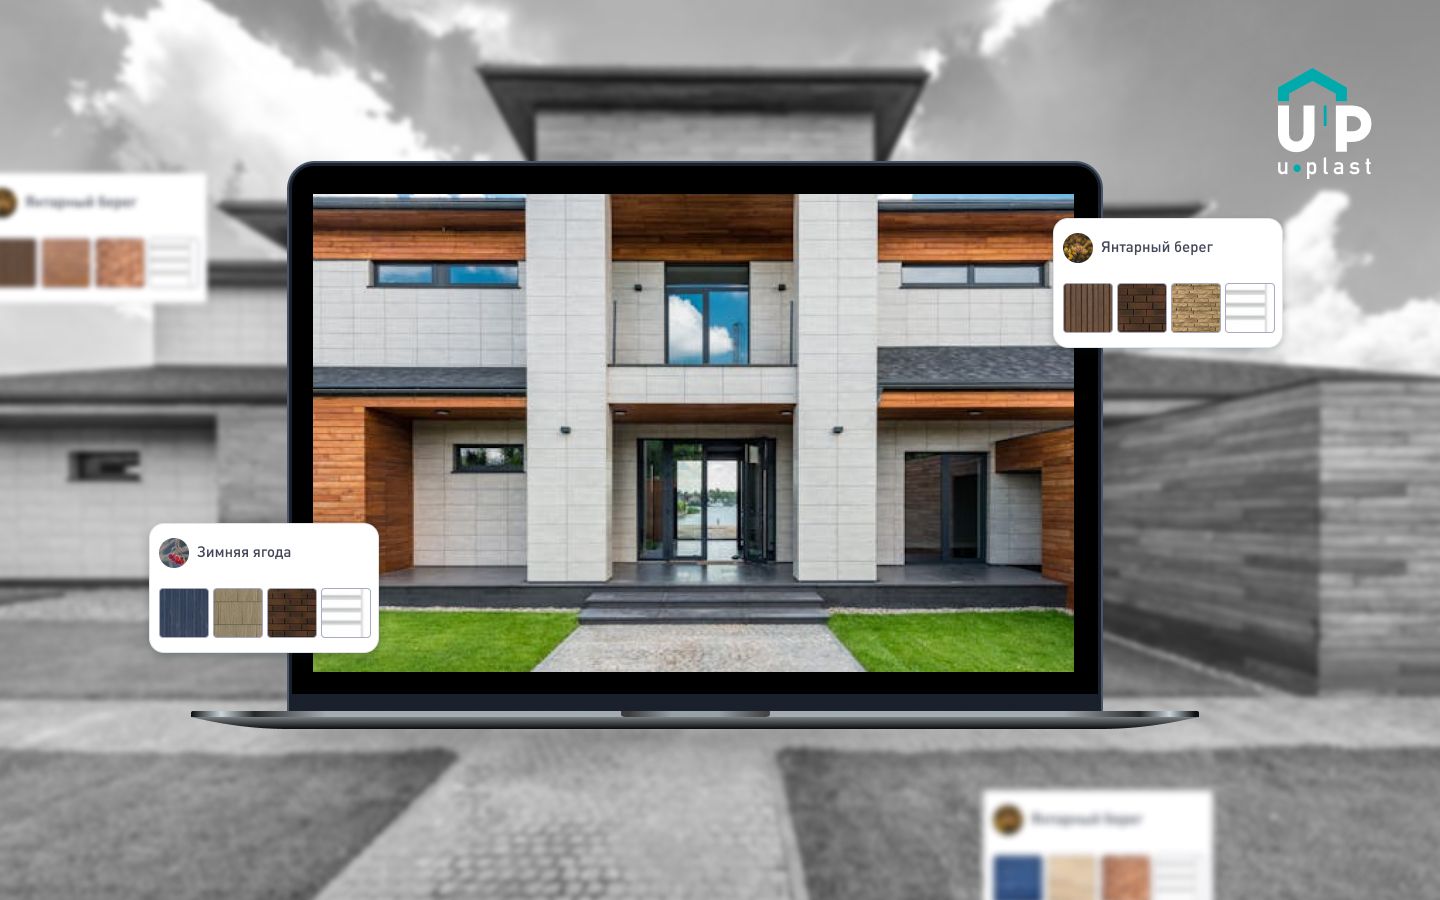
- Navigation through the material catalogue with categorisation (siding, roofing, etc.).
- Overlay of materials in real perspective taking into account the geometry of the building.
- Export projects (image with the selected design, PDF with a list of materials used, printing, the ability to share the result.
- Saving the project in your personal cabinet with further editing.
Key Approaches in Design
Geometry and perspective
- Contour normalisation and artefact removal.
- Correcting angles, slope compensation, and perspective.
- Calculating perspective parameters for realistic display.
Texture manipulation
- Scale-aware generation of material tiles.
- Perspective deformation via Imagick::DISTORTION_PERSPECTIVE.
- Layer building: masks, textures, colour effects.
- Comparison and adjustment of visual result.
Performance
- Caching of deformations and patterns.
- Storing intermediate results to speed up performance.
- Optimisation for large images.
Development Stages
Analytics and Design :
- Designing the architecture of the Visualiser.
- UX Interface Design.
Implementation of the Visualiser core:
- Area selection tools.
- Algorithms of material overlay.
- Working with perspective and geometry.
Integration with personal cabinet:
- Saving and editing projects.
- Export to PDF and images.
Testing and optimisation:
- Geometric algorithms correctness testing.
- UX tests for usability.
Total implementation time: ~ 3 months.
Development Methodology
Kanban methodology was used:
- Iterative addition of functionality.
- Rapid testing cycles.
- Constant synchronisation with the customer.
Technology stack
- Backend: PHP.
- Frontend: JavaScript, HTML, CSS.
- Database: PostgreSQL.
- Graphics and image processing: Imagick.
Why this stack:
- PHP + PostgreSQL provided a stable workflow for big data and user projects.
- Imagick enabled realistic material overlay with perspective.
- JS/HTML/CSS provided a flexible and intuitive editor interface.
Results
- A convenient and powerful tool for selecting facade materials was created.
- Users were able to "try on" siding and roofing on a real photo of their house.
- Customer engagement increased → shortened the buying decision cycle.
- The visualiser became the core of U-Plast's digital ecosystem, linking the website and CRM analytics.
Project team
- Project Manager: 1 person.
- Backend-developers: 2 people.
- Frontend-developers: 2 people.
- UX/UI designer: 1 person.
- Testers: 1 person.