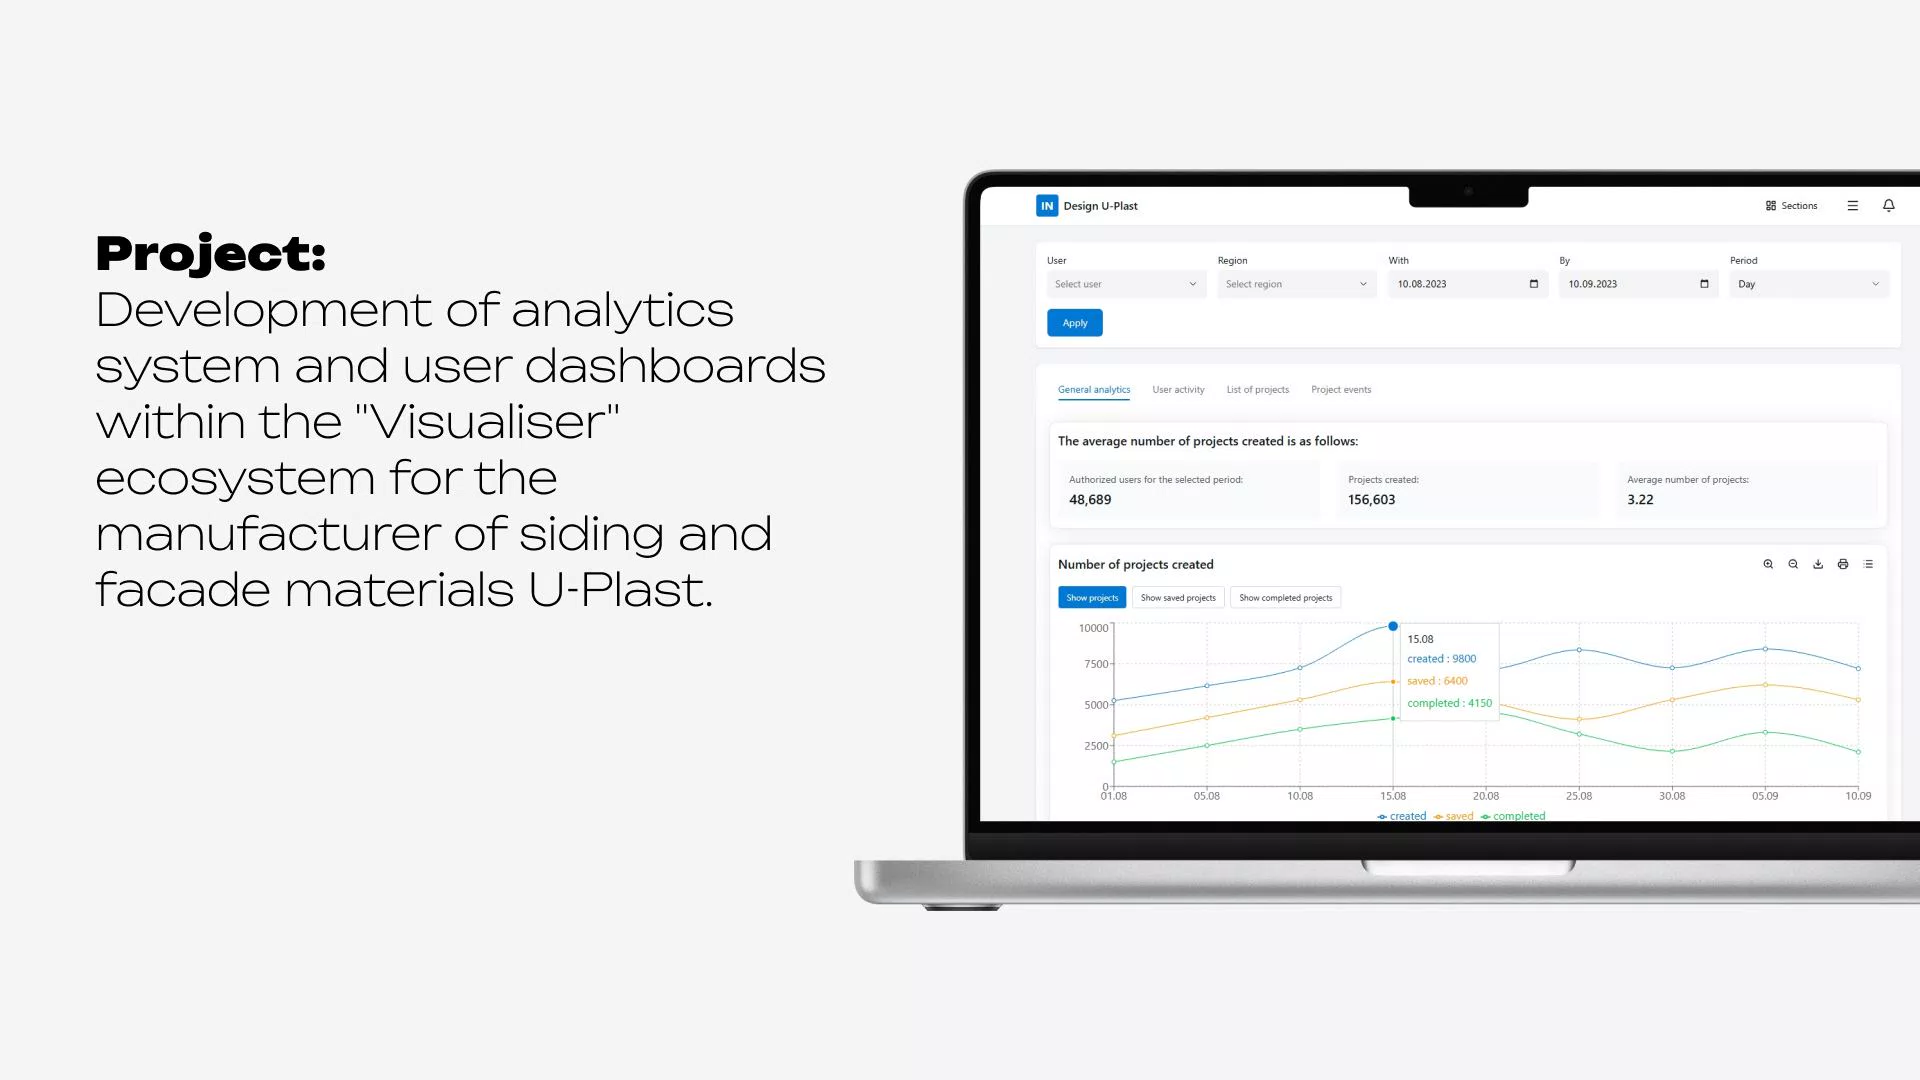
Project: Development of analytics system and user dashboards within the "Visualiser" ecosystem for the manufacturer of siding and facade materials U-Plast.
Project objectives
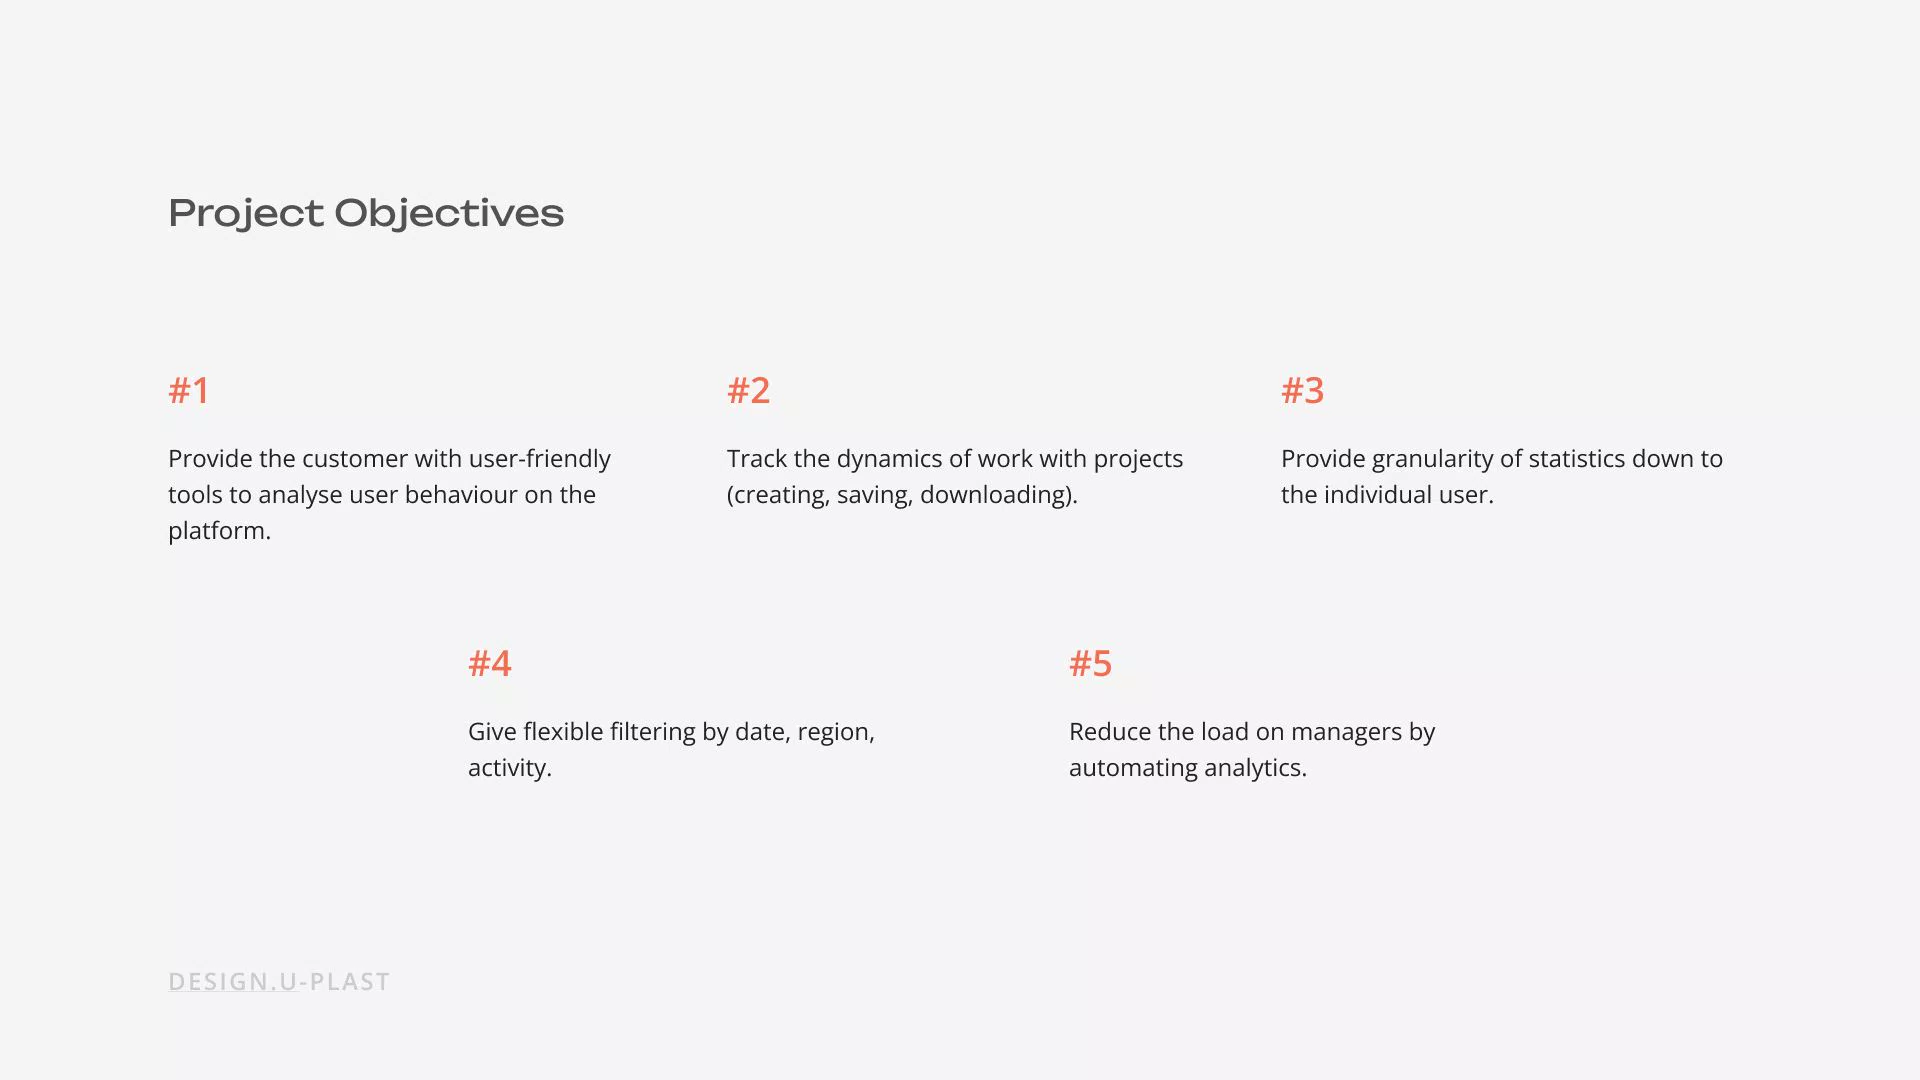
- To provide the customer with convenient tools for analysing user behaviour on the platform.
- Track the dynamics of work with projects (creation, saving, downloading). 3.
- Provide detailed statistics down to the specific user.
- Provide flexible filtering by date, region, activity.
- Reduce the load on managers by automating analytics.
User activity dashboards
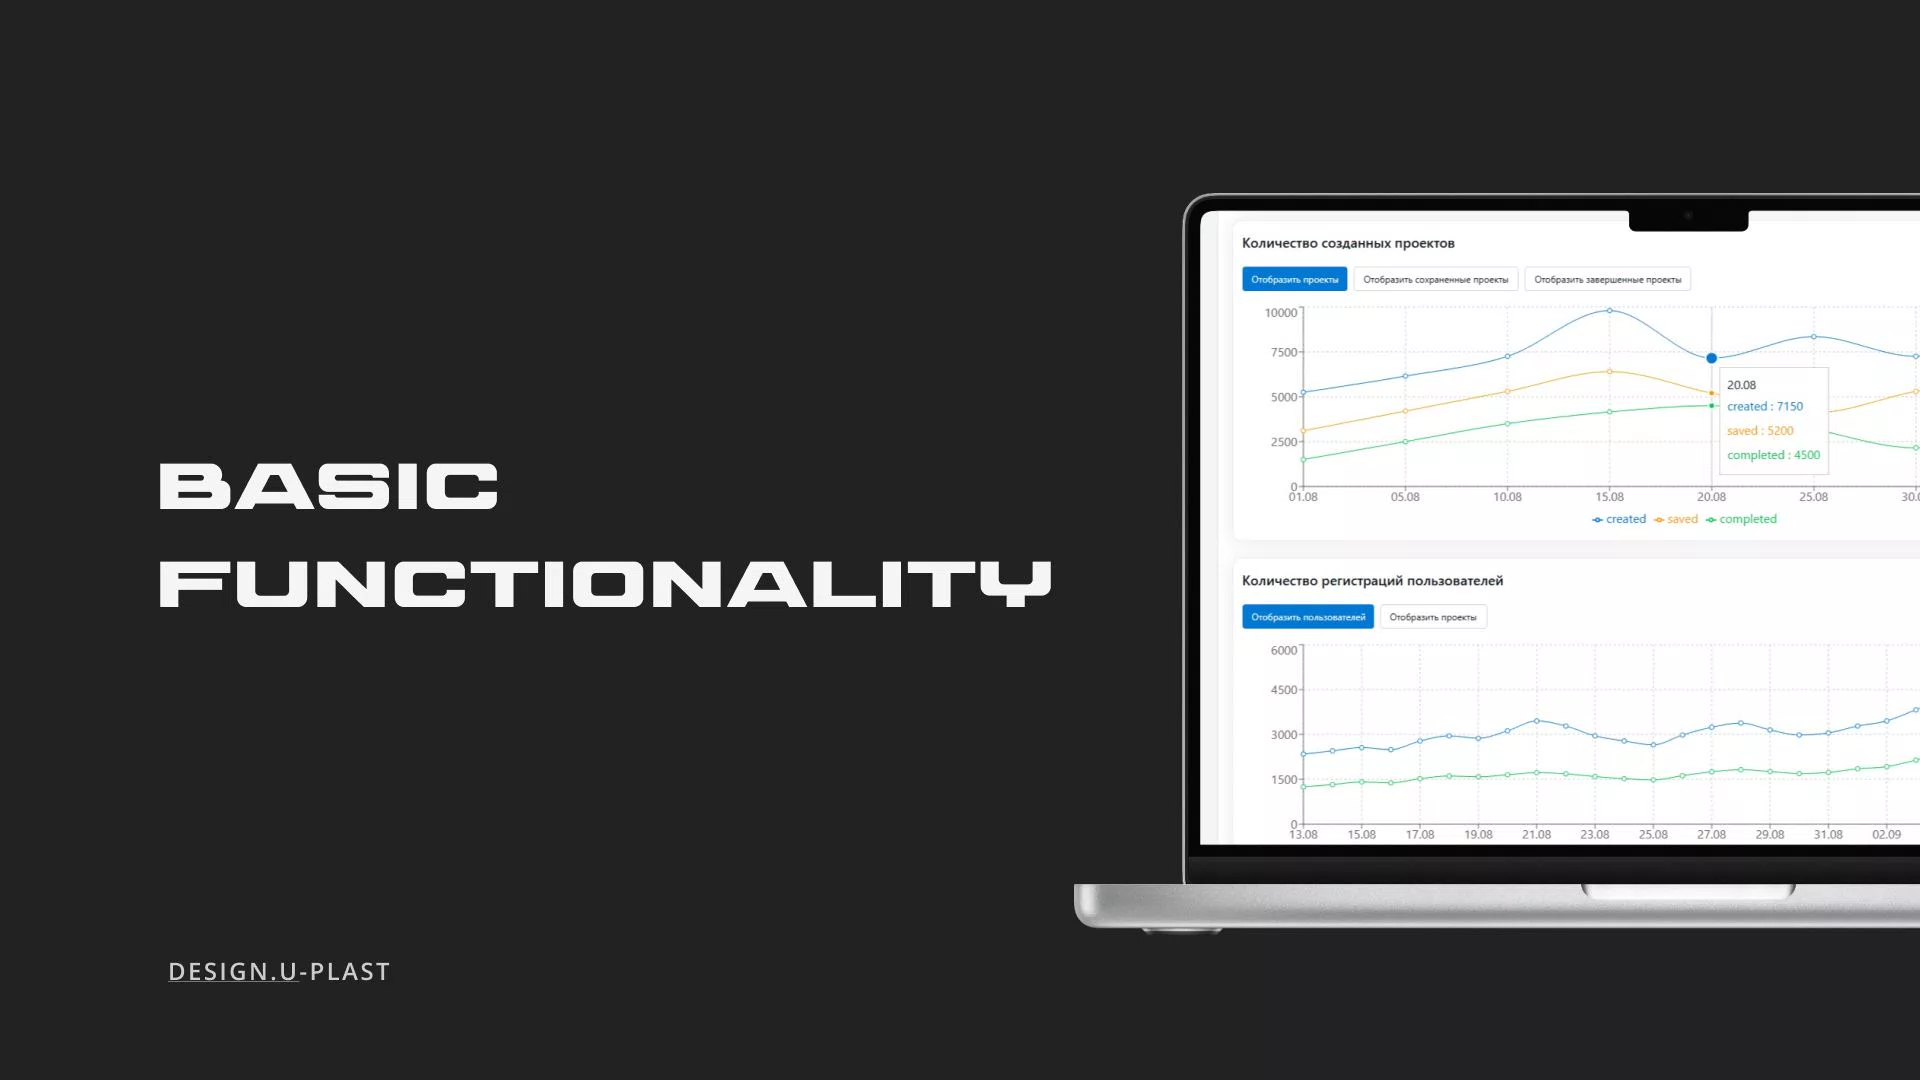
- Number of registered users (by days/weeks/months).
- Number of authorisations for the selected period.
- Number of created projects with details - how many uploaded, how many downloaded, how many saved.
- Average number of projects per user.
- Ability to "drop" from the chart to the list of specific users with sorting and export.
Filters and sorting
- By number of projects.
- By date of registration and authorisation.
- By region.
- By activity (those who started using more or less during the period).
- By number of days without projects.
Administration (User List)
- Full list of users with columns: date of authorisation, number of projects, number of logins.
- Quick sorting by descending/increasing (like in Excel).
Logging user actions
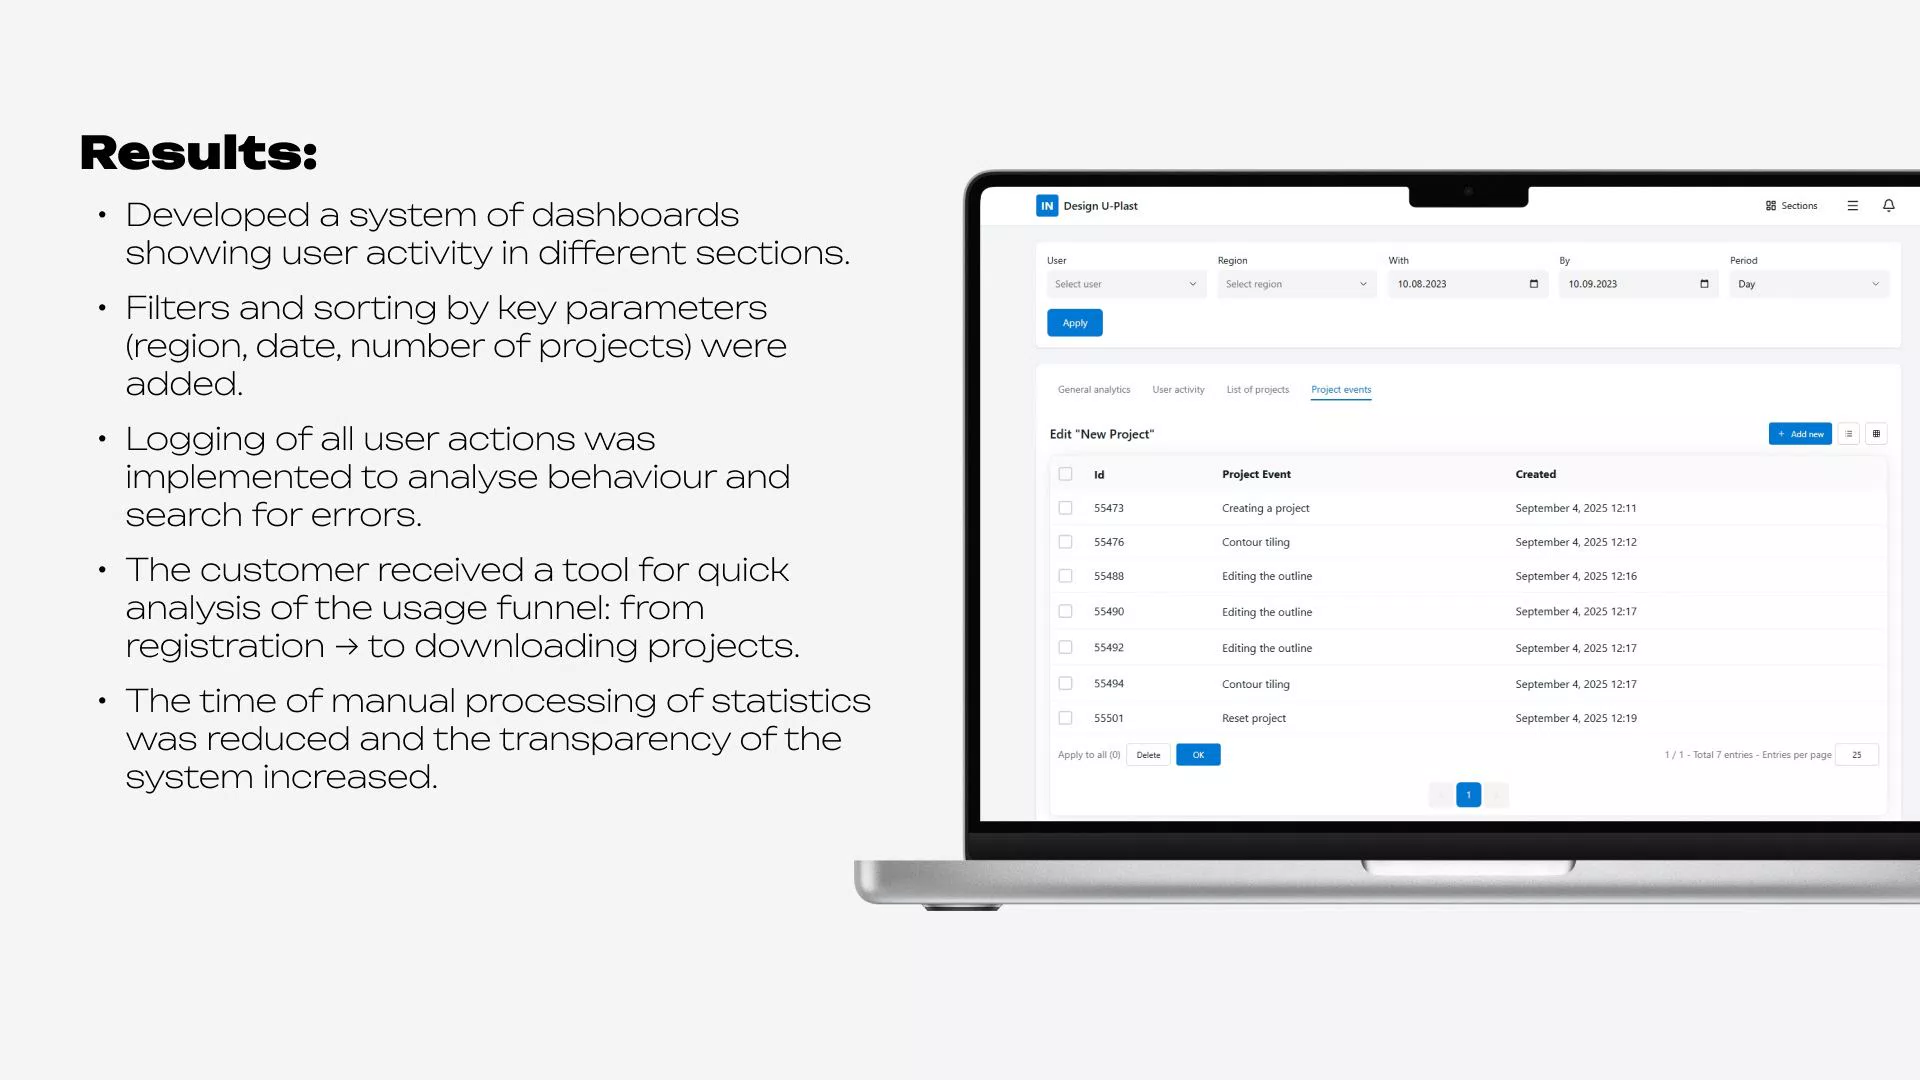
- Project creation.
- Editing a project.
- Creating a contour.
- Editing a contour.
- Closure.
- Saving a project.
- Downloading the project.
Logging made it possible to track work steps and identify errors or bottlenecks in the user scenario.
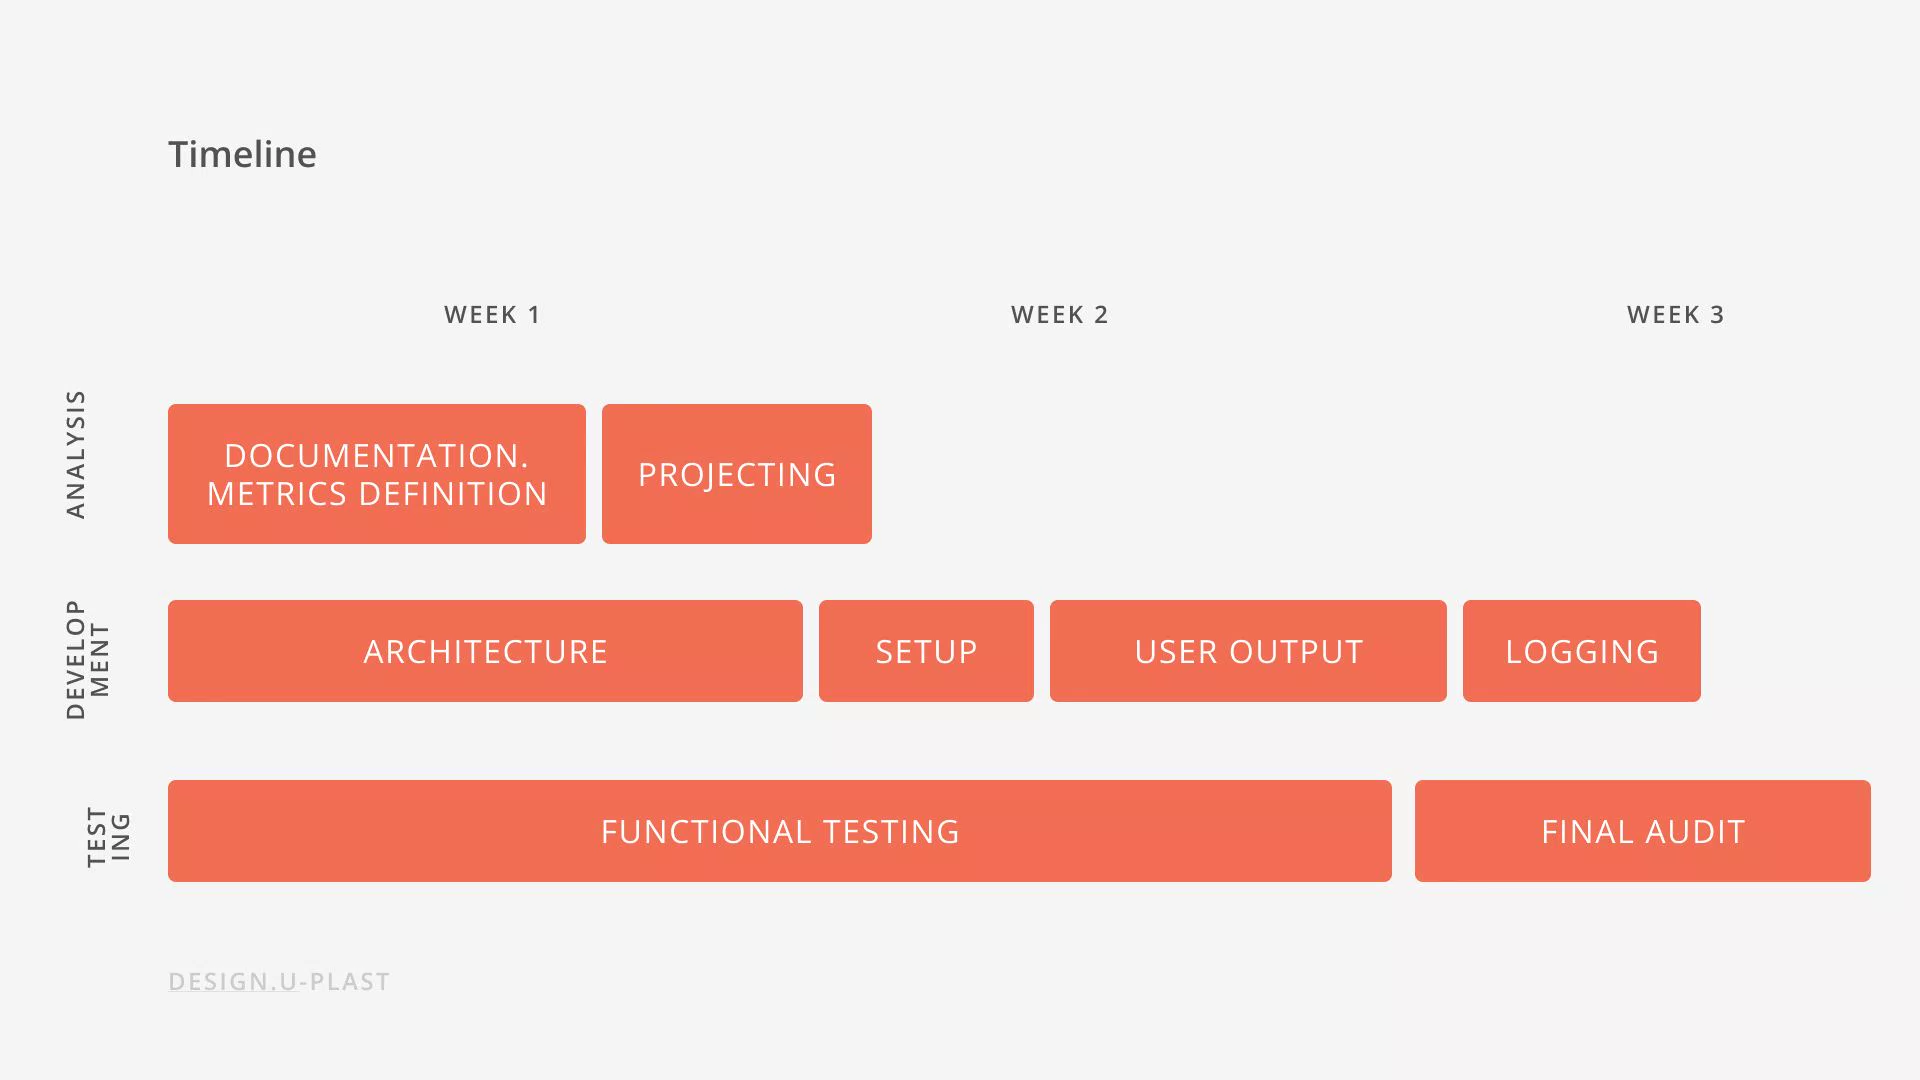
Stages of development
Analysis and design:
- Working with the customer to identify key metrics.
- Designing dashboard structure and links to CRM.
Dashboards Development:
- Implementing charts for registrations, authorisations, project creation and downloads.
- Setting up filtering by dates and regions.
- Ability to switch from a chart to a table of users.
- Adding sorting and exportable tables.
Action Logging:
- Implementing a system to record key user actions.
- Integration of logs into dashboards for behavioural analysis.
Testing and Optimisation:
- Checking that filters, sorts and exports are correct.
- Final UX audit and visualisation refinement.
Total implementation time: ~ 50 hours for dashboards + 8 hours for logging
Development Methodology
Kanban was used:
- Tasks were divided into stages with constant prioritisation.
- Dashboards and logging were implemented iteratively: the customer could immediately see the intermediate results.
Technology stack
- Backend: Symfony (PHP).
- Database: MySQL (storage of logs, statistics, users).
- Frontend: React (dynamic visualisation of charts).
- Analytics libraries: Chart.js / D3.js (interactive charts).
- Data export: XLS/CSV generation.
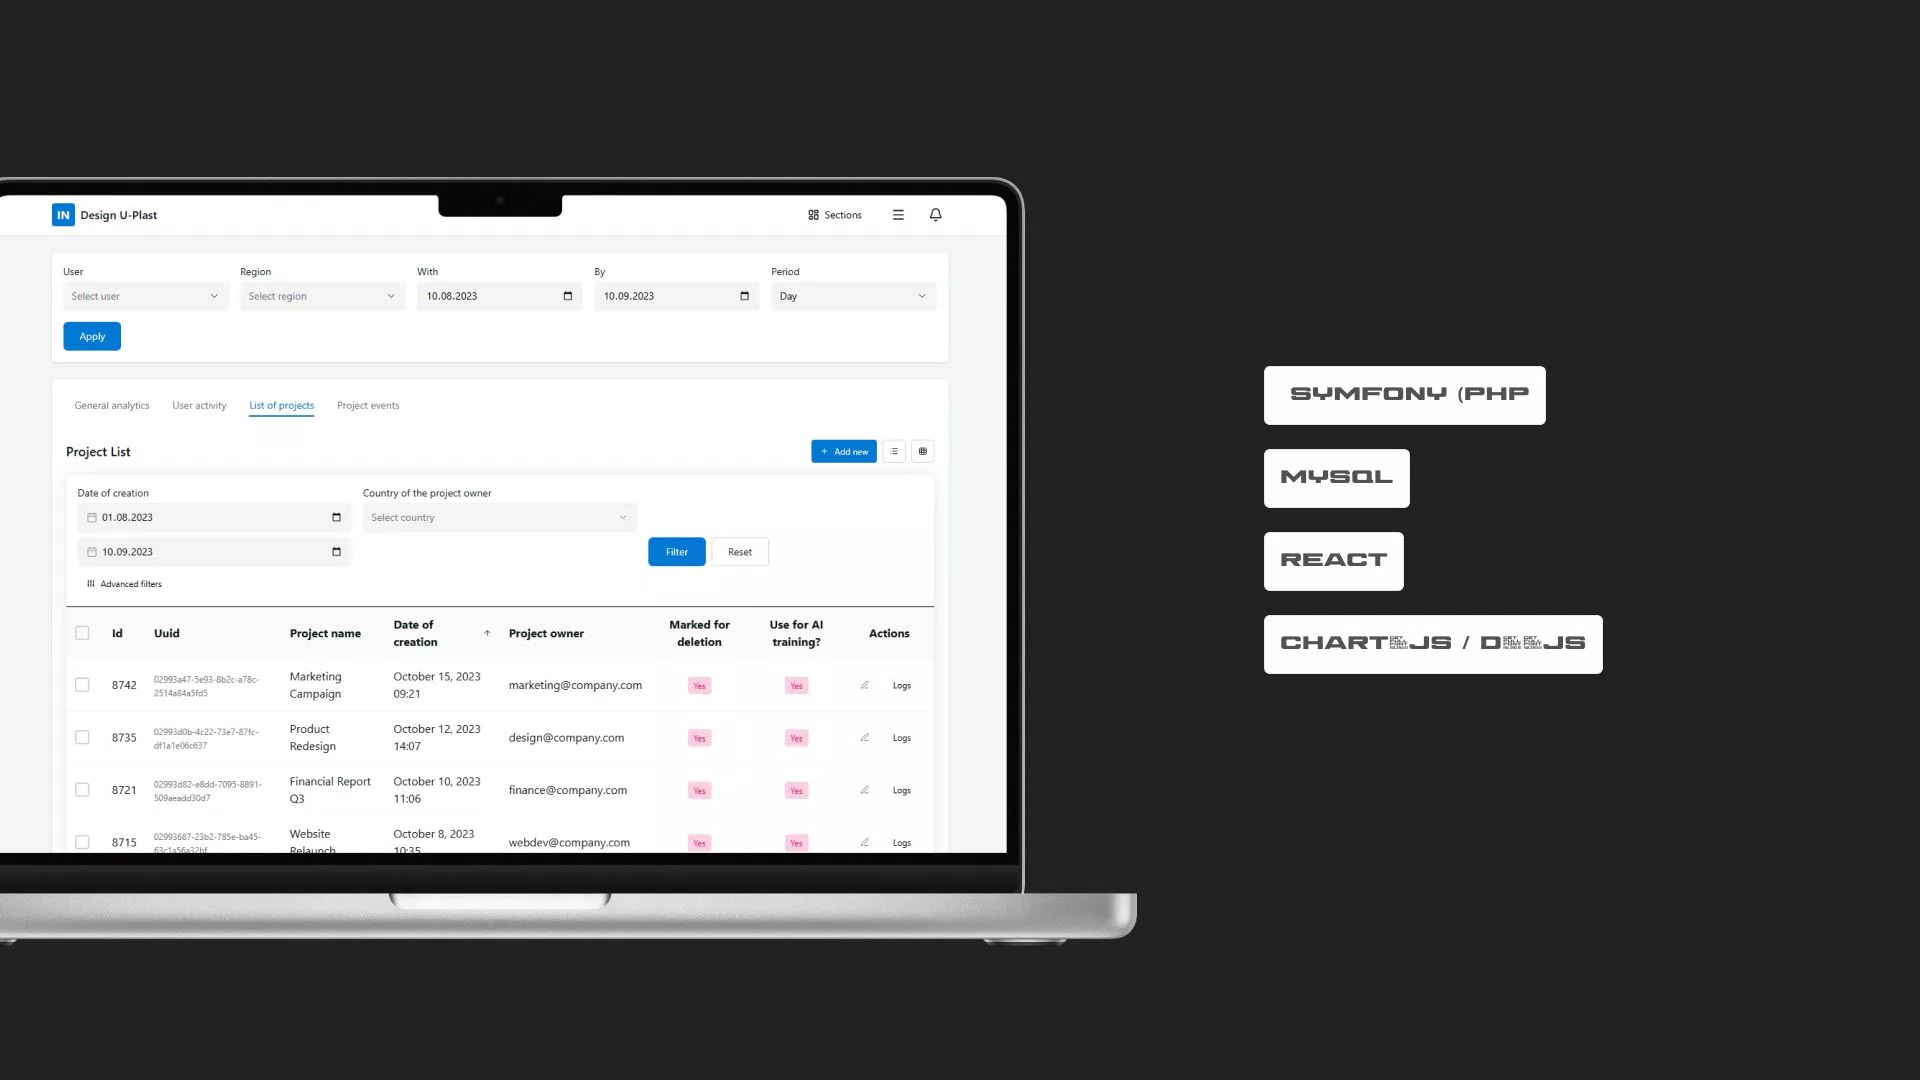
Why this particular stack was chosen:
- Symfony provided fast integration with existing modules of the Visualiser project.
- MySQL - optimal for storing large amounts of event data.
- React + Chart.js - allowed to implement flexible and visual charts with the ability to "dip" into the data.
Related projects: Case 1. U-Plast website, Developing calculator software, Case 2: House Visualiser for U-Plast